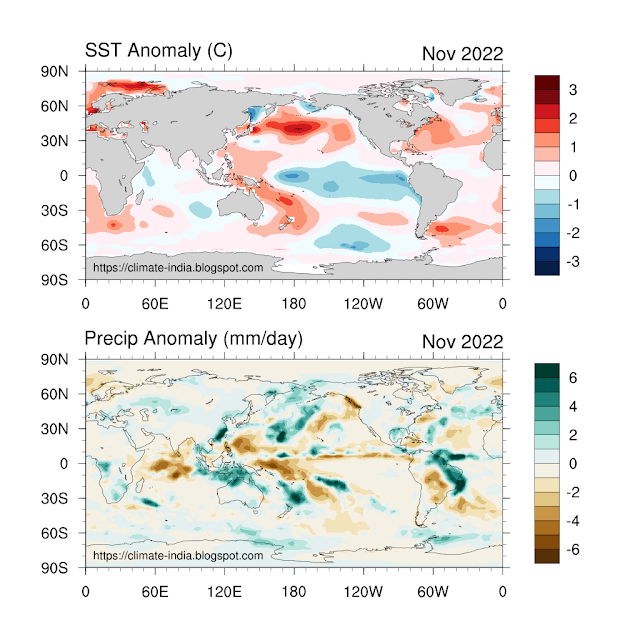
In the first section the observed Sea Surface Temperature (SST) and rainfall anomaly for the month of November 2022 are discussed. Next, the present status, evolution, and prediction of the large-scale climate modes such as El Niño–Southern Oscillation (ENSO) and Indian Ocean Dipole (IOD) that primarily influence the Indian climate are presented. Apart from this the observed weather conditions over India during the month of November 2022 also discussed.
Global patterns of SST and Rainfall
The global observed anomalies of Sea surface temperature (degree C) and rainfall (mm/day) for the previous month (November 2022) is given in Figure 1. The SST anomaly in the equatorial Pacific indicating the existence of La Niña. However, major parts of the global Oceans were with above normal SST anomaly. There was below normal rainfall in the central equatorial Pacific. north Australia and parts of southern Africa and South America in February 2022. Above normal rainfall was observed over equatorial western Pacific, parts of southeast Asia and Maritime continent. Parts of South Africa and South America, northern parts of Australia also had experienced below normal rainfall.
Figure 1: Sea surface temperature (SST) anomaly (C) and Precipitation Anomaly (mm/day) for November 2022. [SST data: NOAA ERSSTv5, Precipitation data: GPCPv2.3, Climatology: 1991-2020]
El Niño–Southern Oscillation (ENSO): Present Status and Prediction
During September - November 2022, the La Niña is present in the Pacific Ocean, where cooler than normal SSTs were observed across central and eastern equatorial Pacific and warmer than normal SSTs were observed over west tropical Pacific Ocean (Fig. 2). The cold SST anomalies over far eastern equatorial Pacific strengthened in October 2022 and then slightly weakened in November 2022. However, in January 2022, the SST anomalies over eastern equatorial Pacific slightly weakened compared to December. The SST anomalies in the equatorial Pacific in November 2022 was indicating a slight weakening of ENSO.
Figure 2: Tropical Pacific Sea surface temperature (SST) anomalies (Left Panel) and changes in the SST anomalies (degree C) from the previous month (Right Panel) during September - November 2022. [SST data: NOAA ERSSTv5, Climatology: 1991-2020]
During September - November 2022, the positive subsurface temperatures anomalies were observed (between 20 C isotherm and thermocline depth) over western Pacific Ocean (135E -165E) (Fig. 3). At the same time, the subsurface temperatures anomalies were negative over the broad area of central and eastern Pacific Ocean below the thermocline depth between 105W to 150W. It was seen during the last three months that the positive subsurface temperature anomalies from western Pacific Ocean expanding eastward whereas the negative subsurface temperature anomalies from central east Pacific Ocean were shrinking towards the eastern Pacific Ocean, indicating the weakening of La Niña.
Figure 3: Depth-longitude section of ocean temperature anomalies (degree C) in the equatorial Pacific Ocean (5S -5N) during September - November 2022. The solid dark line is the 20 degree C isotherm, and the dashed line is thermocline depth. [Source: INCOIS-GODAS]
The monthly time series of ENSO indices for the last 12 months 2022 is shown in Fig. 4. It was seen that all the ENSO indices are below normal during the last 12 months. As per the Nino3.4 index, the strength of La Niña has weakened in the recent month.
Figure 4: ENSO indices (Nino3.4, Nino3, Nino4, Nino1+2, and Modoki) for the past 12 months period. [SST data: NOAA ERSSTv5]
Currently, La Niña conditions are present over the Pacific Ocean. A large majority of the ensemble from the Monsoon Mission Coupled Forecasting System (MMCFS) model based on the November initial conditions indicates that La Niña conditions are likely to continue till December-February and weaken thereafter, to reach cold ENSO neutral conditions during the second quarter of 2023 (Fig.5).
Figure 5: Monsoon Mission Climate Forecasting System (MMCFS) model based probabilistic Niño 3.4 index forecasts (Top) and plume of forecasts of the Niño 3.4 index (Bottom) as provided by India Meteorological Department (IMD). [Source: http://rcc.imdpune.gov.in/Products.html]
Indian Ocean Dipole (IOD): Present Status and Prediction
In the month of September and October 2022, the negative IOD conditions were prevailing over Indian Ocean, but neutral IOD conditions were observed in November 2022. Most parts of Bay of Bengal and Arabian Sea remained warmer than normal during September - November 2022 (Fig. 6). Compared to the October, the November SST anomaly over western equatorial Indian Ocean were warmed up whereas the SST anomaly over the eastern equatorial Indian Ocean were cooled down.
Figure 6: Indian Ocean Sea surface temperature (SST) anomalies (Left Panel) and changes in the SST anomalies (degree C) from the previous month (Right Panel) during September - November 2022. [SST data: NOAA ERSSTv5, Climatology: 1991-2020]
In the month of September and October 2022, the positive subsurface temperature anomalies (Fig. 7) were seen over the eastern equatorial Indian Ocean (between 20oC isotherm and thermocline depth) indication of a negative IOD. However, the sub-surface warm anomaly over eastern equatorial Indian Ocean was drastically weakened in the month of November, indication of the termination of negative IOD.
Figure 7: Depth-longitude section of ocean temperature anomalies (degree C) in the tropical Indian Ocean (10S - Equator) during December 2021 (Top), January 2022 (Middle) and February 2022 (Bottom). The solid dark line is the 20 degree C isotherm, and the dashed line is thermocline depth. [Data: INCOIS-GODAS]
The monthly time series of Dipole Mode Index (DMI), West Equatorial Indian Ocean (WEIO) index, East Equatorial Indian Ocean (EEIO) index for the last 12 months is shown in Fig.8. The figure indicates that western equatorial Indian Ocean was warmer than normal and eastern equatorial Indian Ocean was colder than normal during most parts of the last 12 months. The negative IOD which was in peak during July and August was weakened and turned to neutral in the month of November.
Figure 8: IOD indices (DMI, WEIO, and EEIO) for the past 12 months period. [Dipole Mode Index (DMI), West Equatorial Indian Ocean (WEIO), East Equatorial Indian Ocean (WEIO) index.
Currently, neutral IOD conditions are present over the Indian Ocean and the latest Monsoon Mission Climate Forecasting System (MMCFS) model forecast indicates that the neutral IOD conditions are likely to continue during the forecast period (Figure 9). The probability forecast for IOD also indicates the enhanced probability for neutral IOD conditions during most of the forecast period.
Figure 9: Monsoon Mission Climate Forecasting System (MMCFS) model based probabilistic IOD forecasts (Top) and plume of forecasts of the IOD index (Bottom) as provided by India Meteorological Department (IMD). [Source: http://rcc.imdpune.gov.in/Products.html]
Observed Climate of India for November 2022
It was seen that most parts of India received below normal rainfall in the month of November 2022 (Figure 10). The observed rainfall over the country as a whole for the month of November 2022 was 18.7 mm, which was 37% less than its Long Period Average of 29.7 mm. However, the southern parts of peninsular India received good amount of rainfall during the month of November. The southern part of India normally receives good rainfall during October-December season as part of the northeast monsoon activity.
Figure 10: Observed (left), climatology (middle), and anomaly (right) of rainfall over India for the month of November 2022 (Climatology and anomaly based on 1971 to 2020 period). *Based on Realtime Data [Source: IMD]
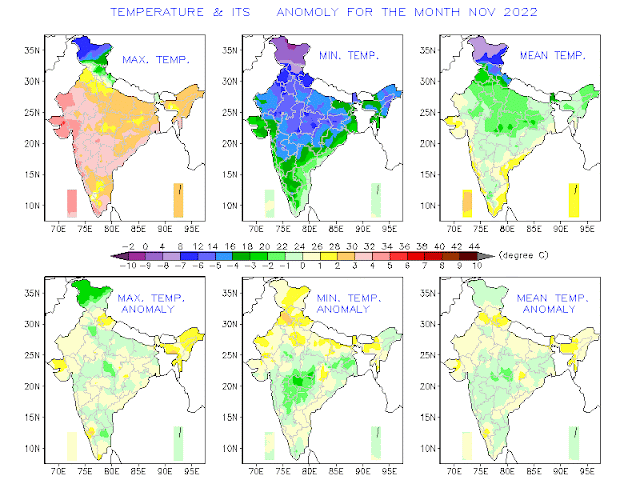
The observed monthly average maximum, minimum and mean temperature over India and their anomaly (1981-2010 climatology) for the month of November 2022 is given in Figure 11. As per the IMD record, the observed average maximum, minimum and mean temperature for the country as a whole during November 2022 were 29.37 ºC, 17.69 ºC, and 23.53 ºC respectively, against the climatological normal (1981-2010) value of 29.03 ºC, 17.40 ºC and 23.22 ºC. The average maximum temperature, minimum temperature and mean temperature over India as whole are above normal by 0.34 ºC, 0.29 ºC, and 0.31 ºC respectively.
Figure 11: Observed (top) maximum temperature, minimum temperature, and mean temperature and the anomaly (bottom) of over India for the month of November 2022 (Climatology and anomaly based on 1981 to 2010 period). *Based on Realtime Data [Source: IMD]
India experienced heavy to extremely heavy rainfall events mainly over Tamil Nadu, Puducherry & Karaikal, Kerala & Mahe, and Coastal Andhra Pradesh as part of the northeast monsoon rainfall activity (Figure 12)
Figure 12: The location of occurrences of heavy rainfall events in the month of November 2022. [Source: IMD]
India experienced a couple of significant weather events (snowfall, coldwave, lightning, and floods/heavy rain) in the month of November 2022 which caused loss of human lives (Figure 13)
Figure 13: Significant weather events experienced over India during November 2022 (Based on real-time media report) [Source: IMD]
References
Ratna, S. B., A. Cherchi, T. J. Osborn, M. Joshi, and U. Uppara, 2021: The Extreme Positive Indian Ocean Dipole of 2019 and Associated Indian Summer Monsoon Rainfall Response, Geophysical Research Letters, https://doi.org/10.1029/2020GL091497
http://rcc.imdpune.gov.in/Products.html
https://incois.gov.in/portal/ElNino
https://incois.gov.in/portal/IOD
https://www.satyabanbratna.com/


Comments
Post a Comment