ENSO, IOD and observed climate of India - May 2022
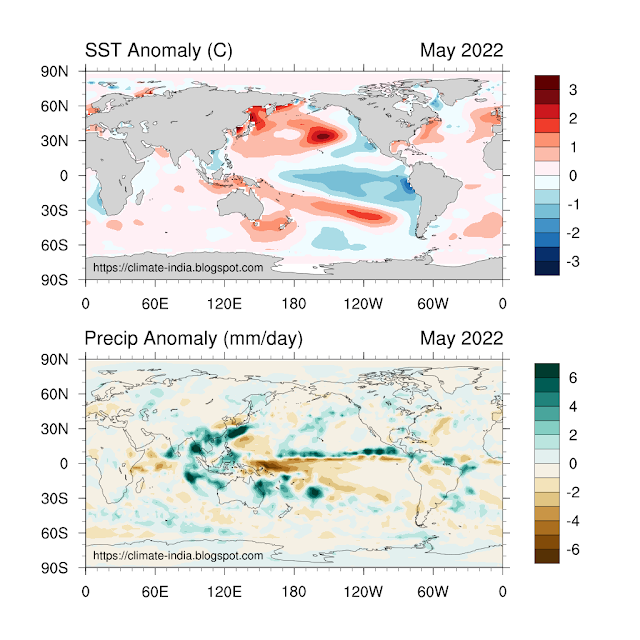
In the first section the observed Sea Surface Temperature (SST) and rainfall anomaly for the month of May2022 are discussed. Next, the present status, evolution, and prediction of the large-scale climate modes such as El Niño–Southern Oscillation (ENSO) and Indian Ocean Dipole (IOD) that primarily influence the Indian climate are presented. Apart from this the observed weather conditions over India during the month of May 2022 also discussed. Global patterns of SST and Rainfall Figure 1: Sea surface temperature (SST) anomaly (C) and Precipitation Anomaly (mm/day) for May 2022. [SST data: NOAA ERSSTv5, Precipitation data: GPCPv2.3, Climatology: 1991-2020] El Niño–Southern Oscillation (ENSO): Present Status and Prediction Figure 2 : Tropical Pacific Sea surface temperature (SST) anomalies (Left Panel) and changes in the SST anomalies (degree C) from the previous month (Right Panel) during March - May 2022. [SST data: NOAA ERSSTv5, Climatology: 1991-2020] Figure 3: Depth-longitude sect


